

This week in part 3 of the Yarn Bleeding Experiment, it’s time to actually do some science!
If you haven’t already, head back and read Part 1 & Part 2 first, so you know what’s going on.
Jump Links
Part 1: Introduction
Part 2: The Experiment
Part 3: Round One – Temperature
Part 4: Round Two – Wool Wash (Soak)
Part 5: Round Two – Wool Wash (Eucalan)
Part 6: Round Two – White Vinegar
Part 7: Round Two – Washing Up Liquid
Part 8: Round Three – Colour Catcher
Part 9: Results & Conclusion
Okay, all caught up? Great.
I need to make one very important point before we get started. It turns out that my cereal bowls are too small to hold 500ml water, so for this and all other experiments, instead of pouring out 500ml for each bowl, I have used 300ml.
Right, that’s that out of the way. Let’s crack on!
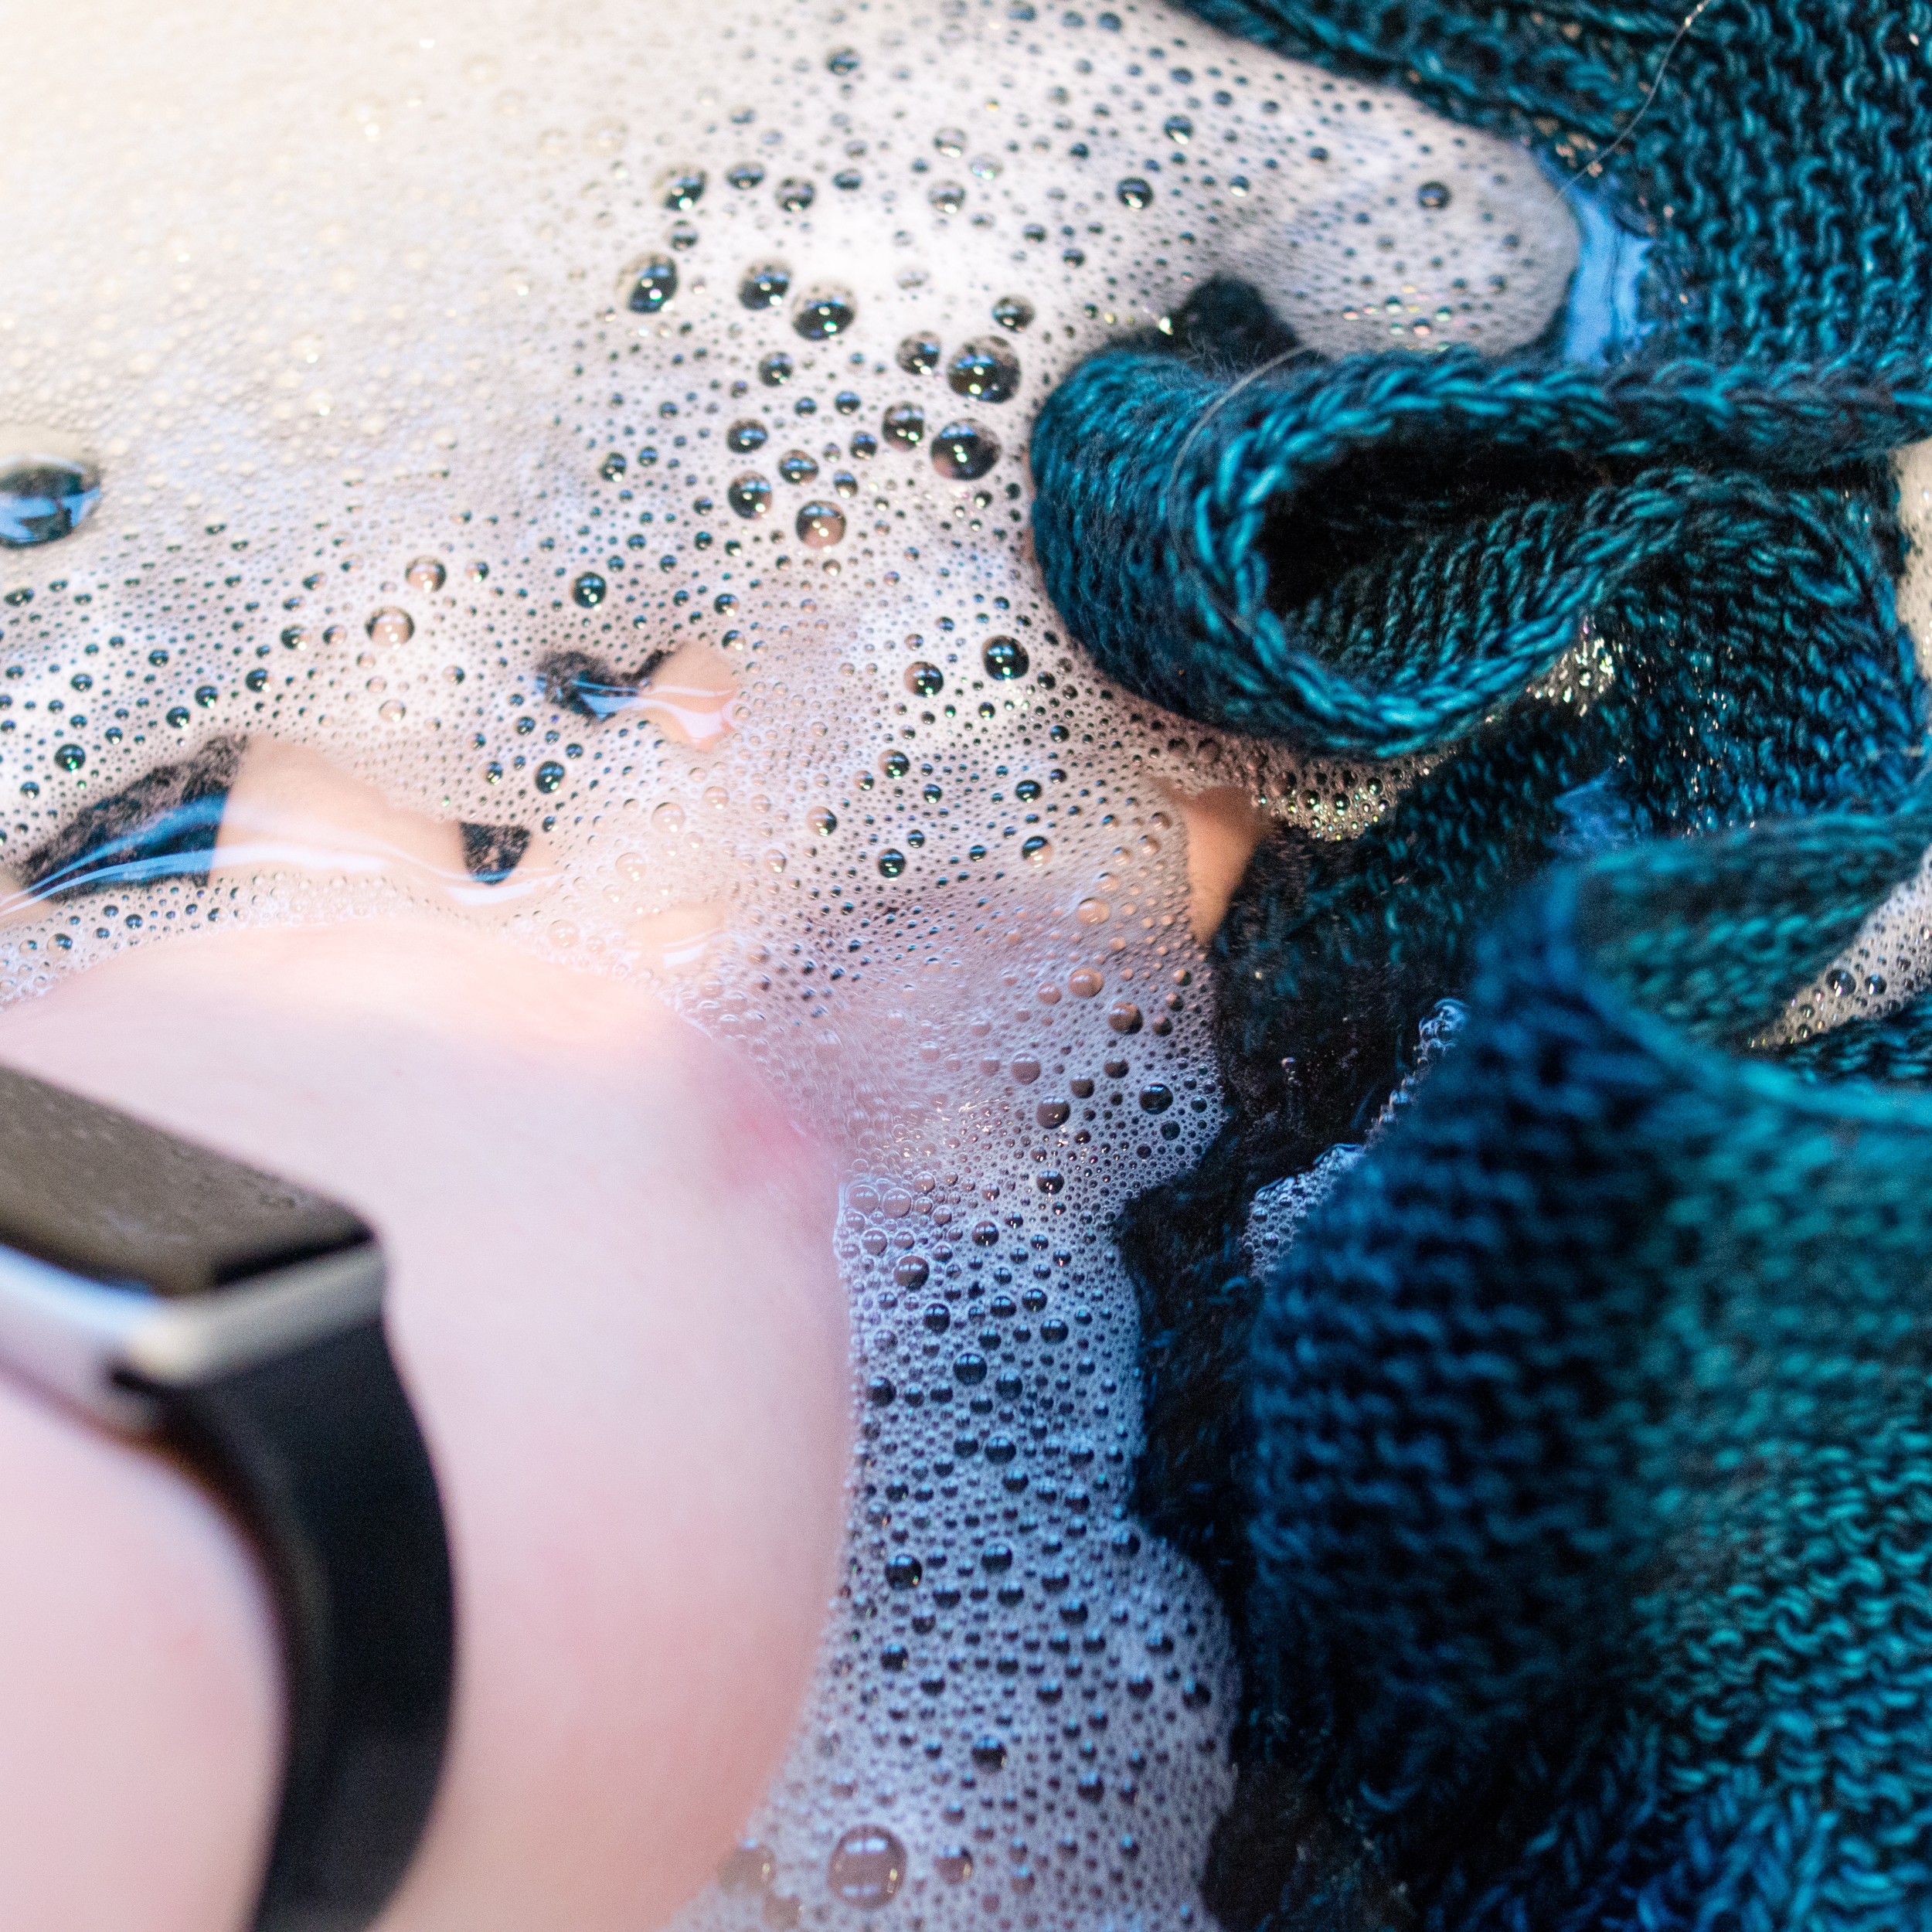
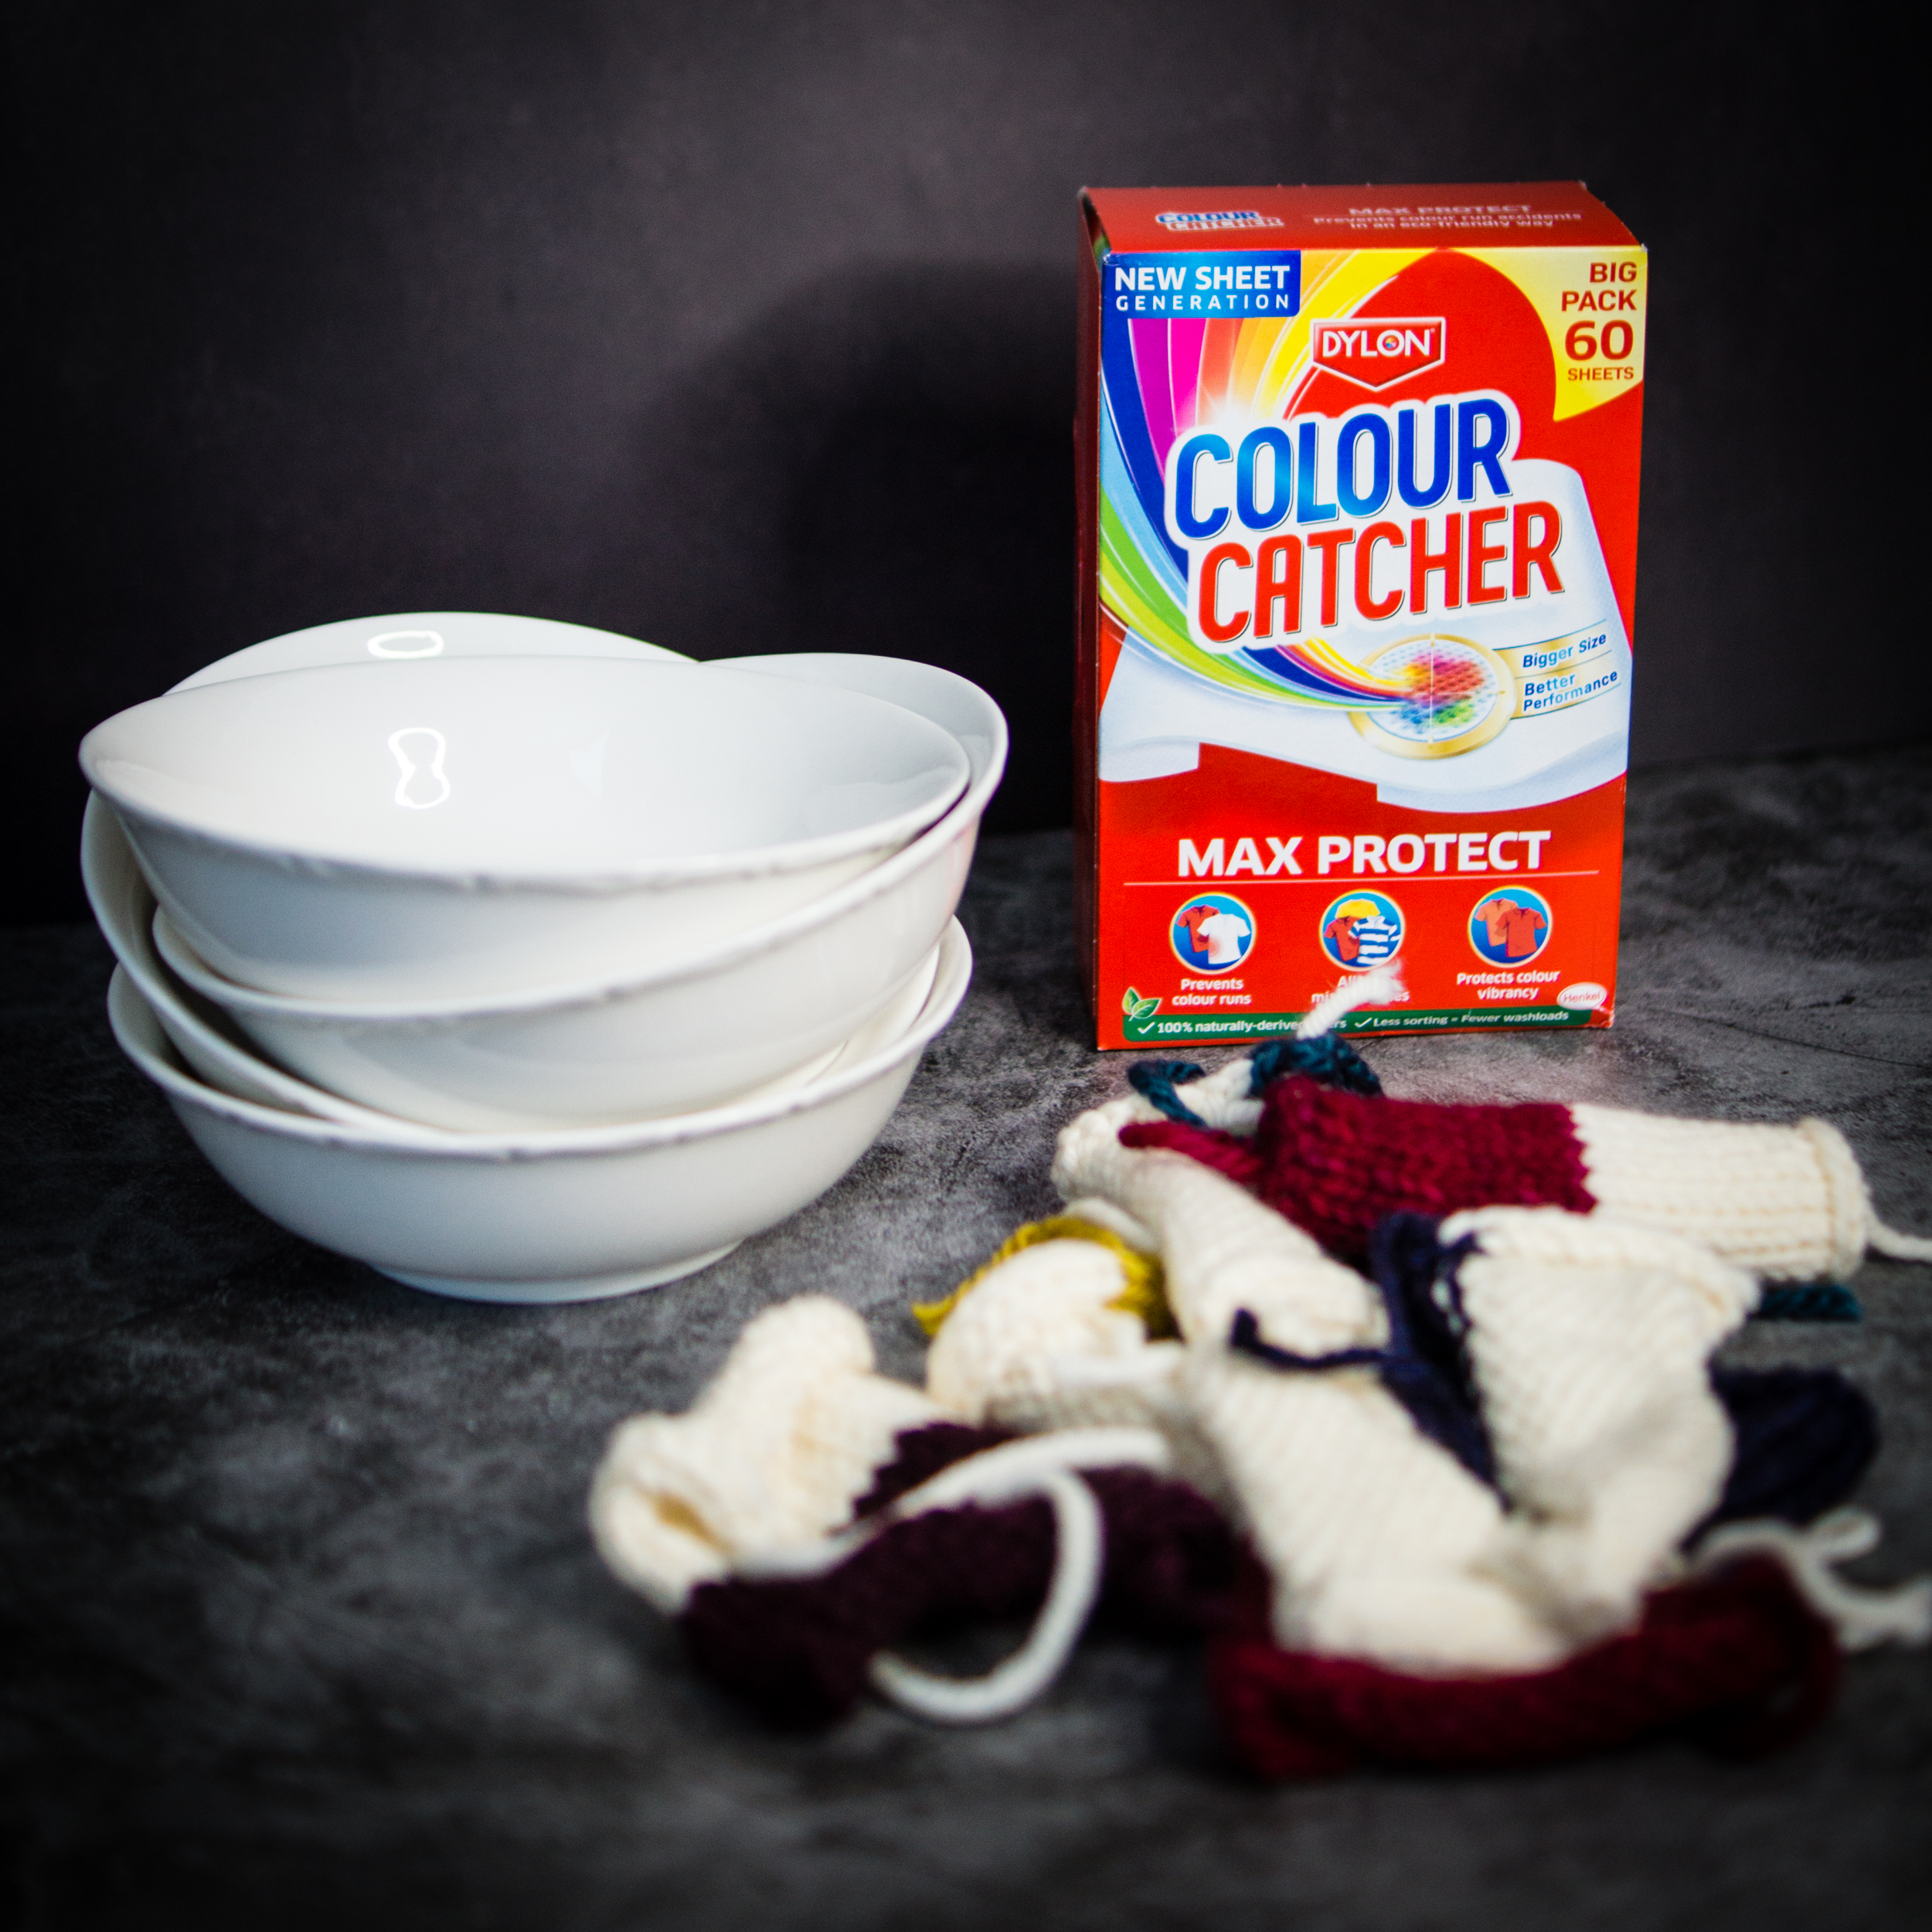
A quick recap: I put 1 swatch in each of 5 colours into a cereal bowl, poured water over, left it for 30 minutes, then looked to see how much it had bled. I used water that was 10C, then 30C, then 50C. Bleeding is rated on a scale of 0-2: 0 is no bleeding, 1 is a little bleeding, 2 is significant bleeding.
I kept the swatches in the same positions for each temperature for easy comparison.
Here’s the results – 10C on the left, 30C in the middle, 50C on the right:
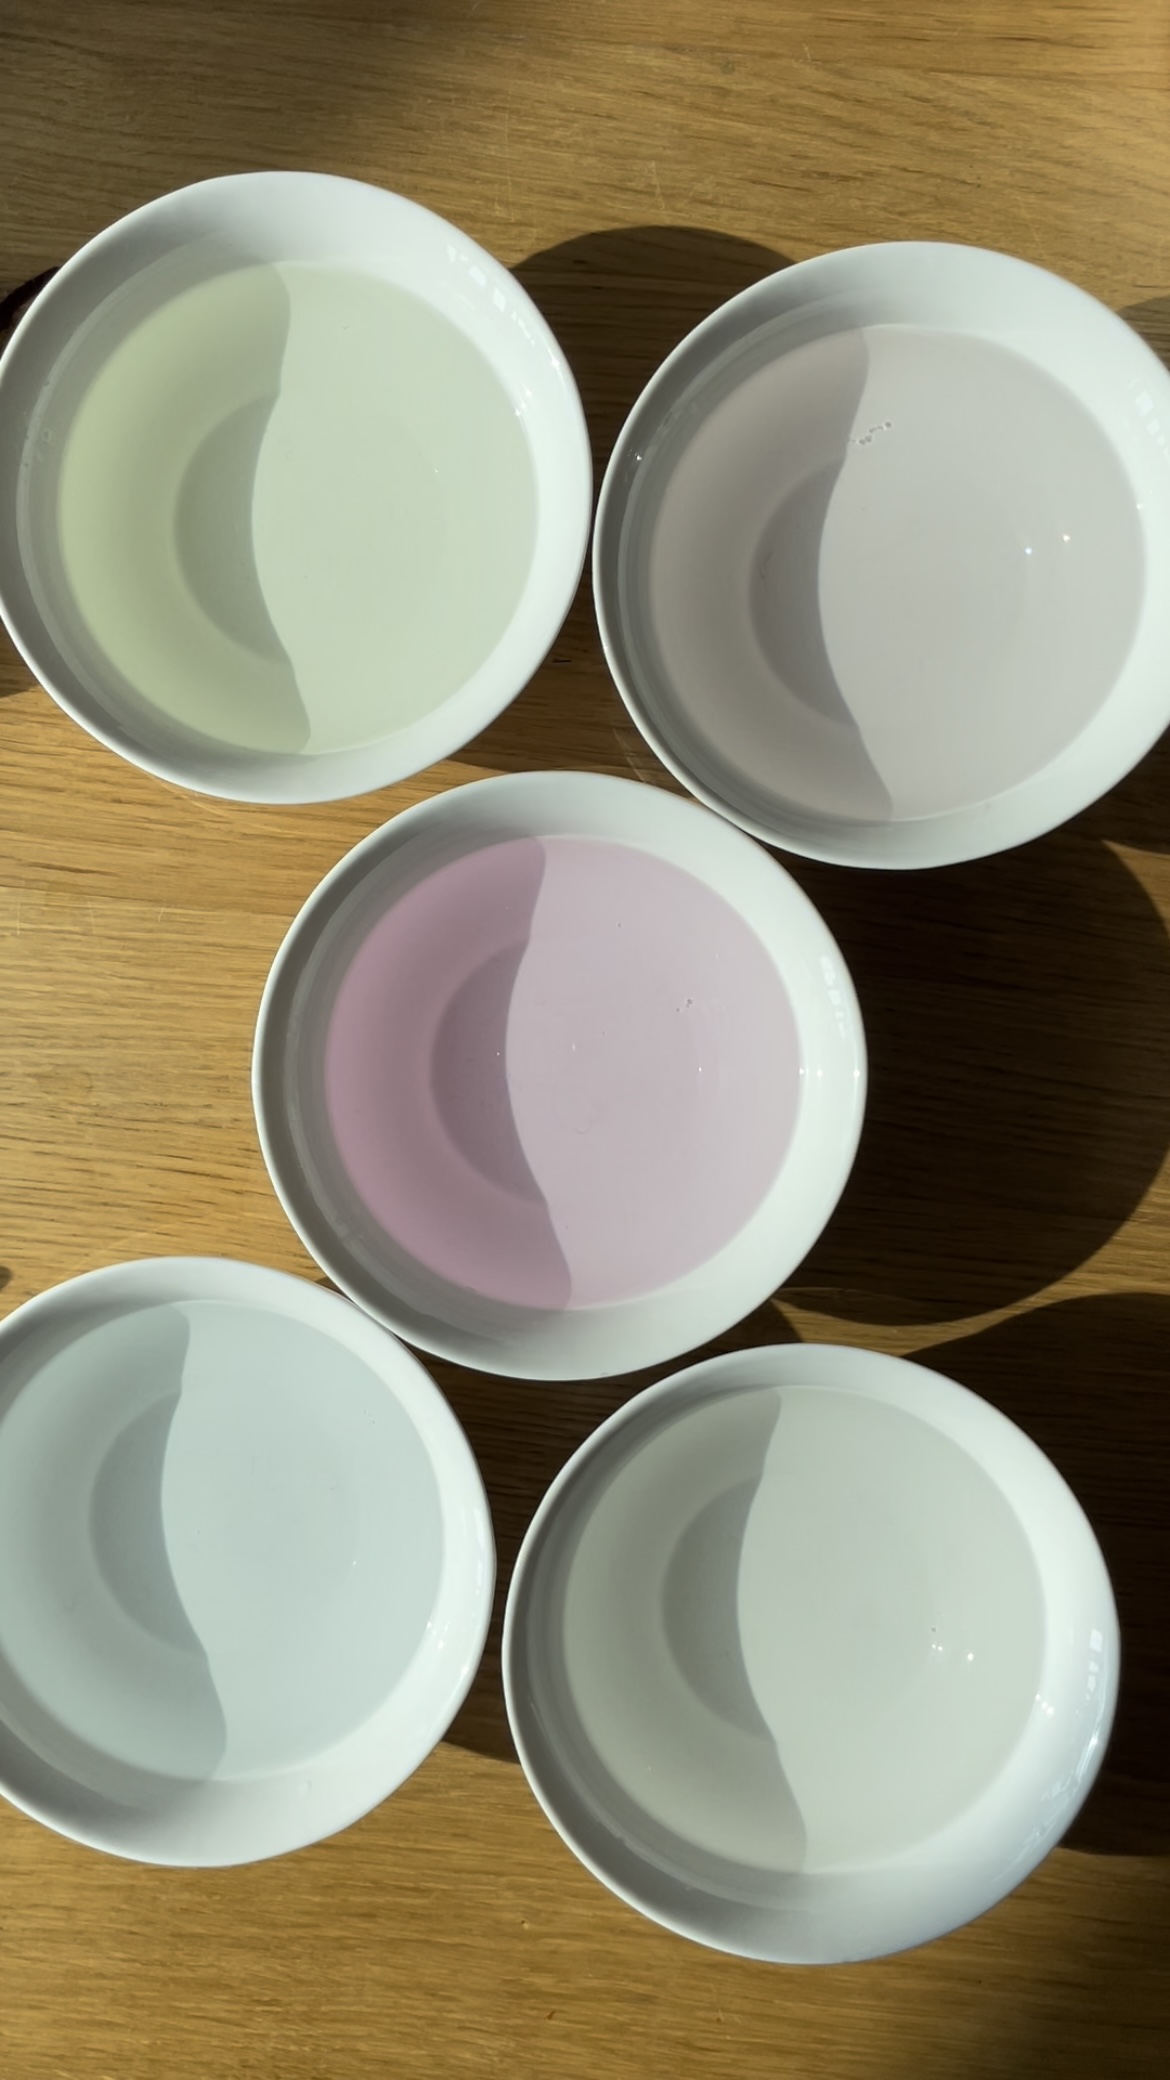
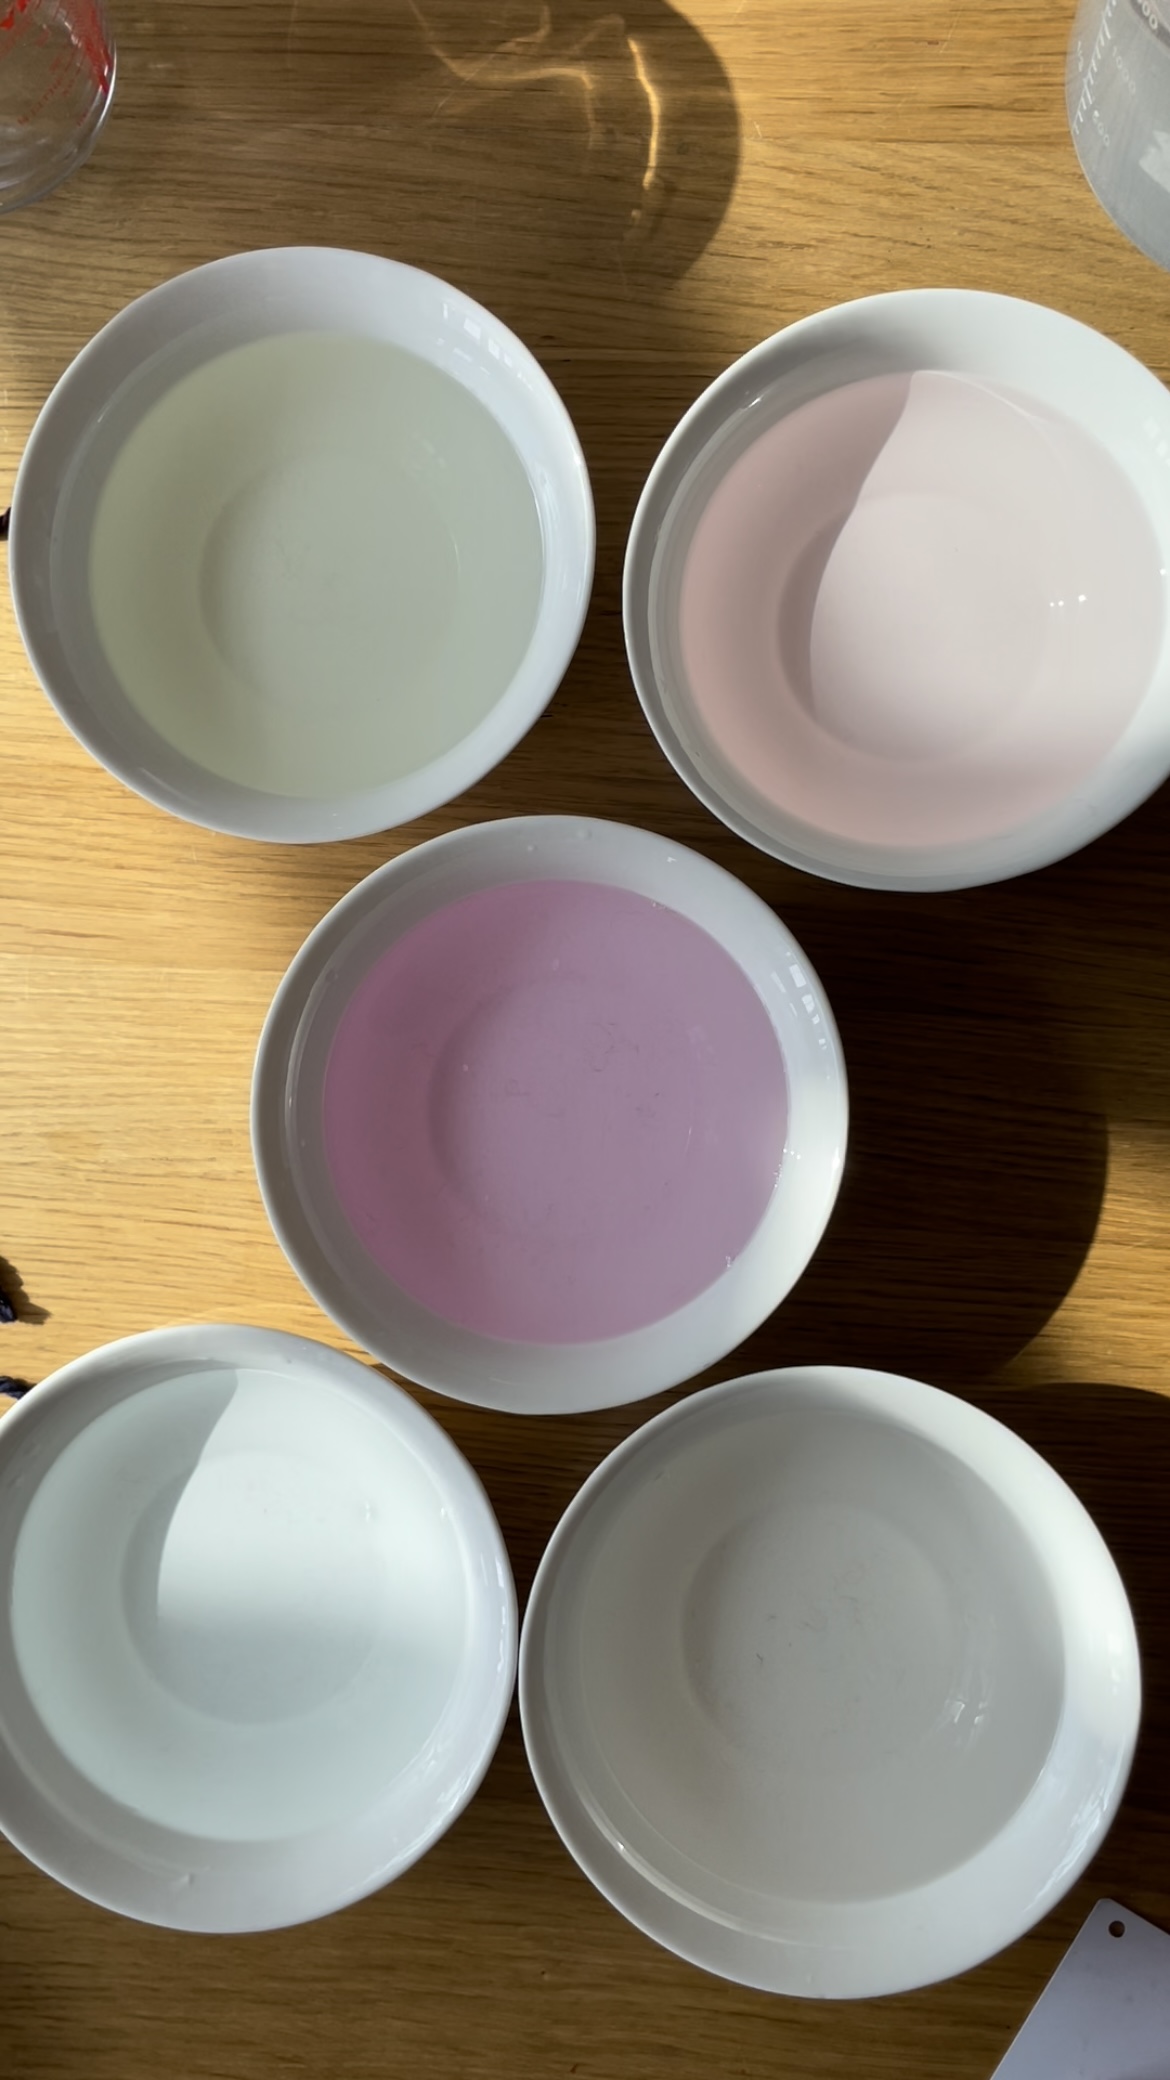
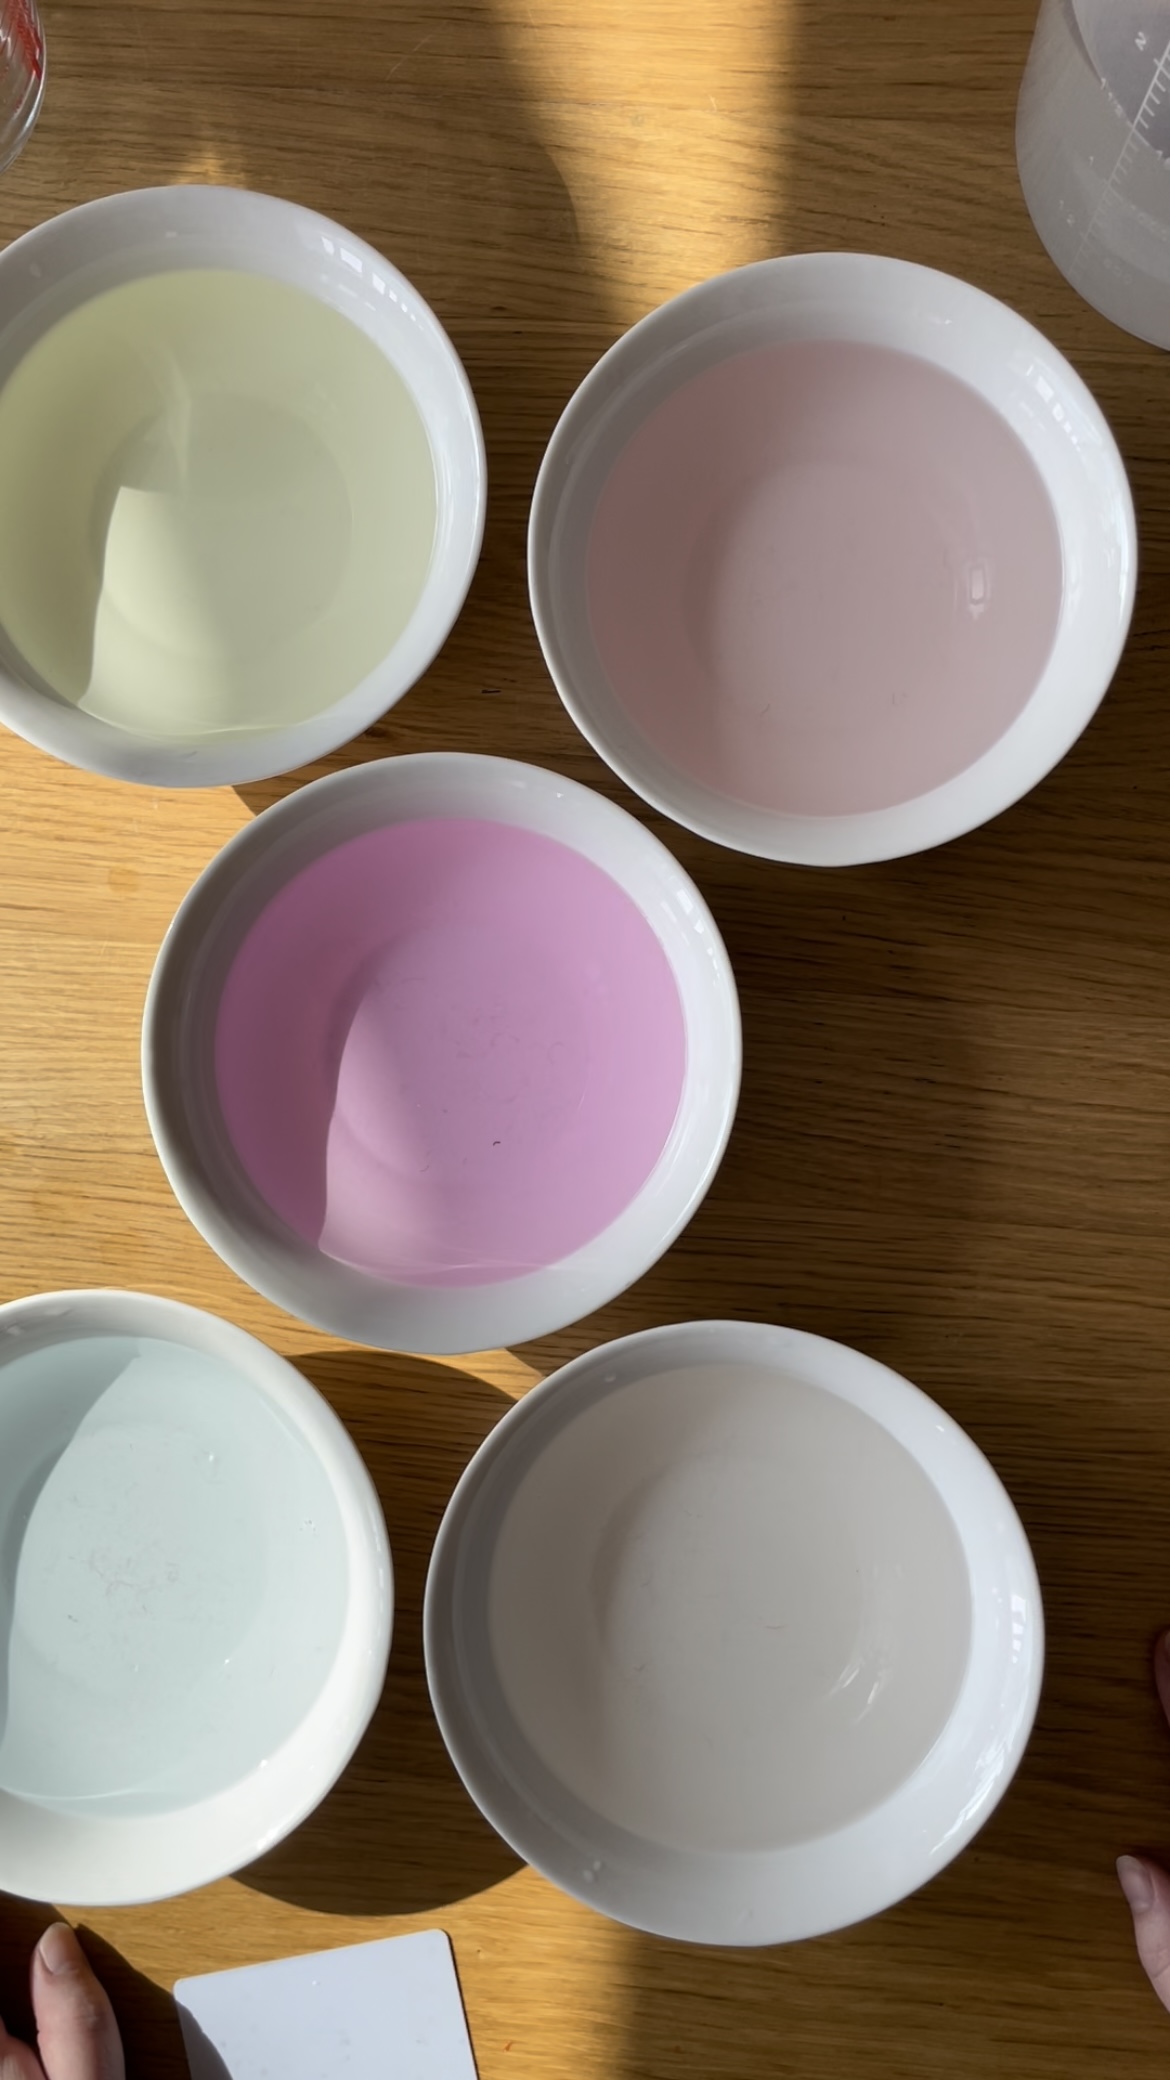
Top: Litha, Blackcurrant Jam. Middle: Ruby Slippers. Bottom: Storm, OOAK Navy.
When you line them up like that the results are pretty obvious, aren’t they! Higher temperature definitely leads to more bleeding – and the higher the temperature, the more it bleeds.
Here’s how I ranked each one:
10C:
Litha – 1, Blackcurrant Jam – 1, Ruby Slippers – 1, Storm – 1, Navy – 0
30C:
Litha – 1, Blackcurrant Jam – 1, Ruby Slippers – 2, Storm – 1, Navy – 1
50C:
Litha – 2, Blackcurrant Jam – 2, Ruby Slippers – 2, Storm – 1, Navy – 1
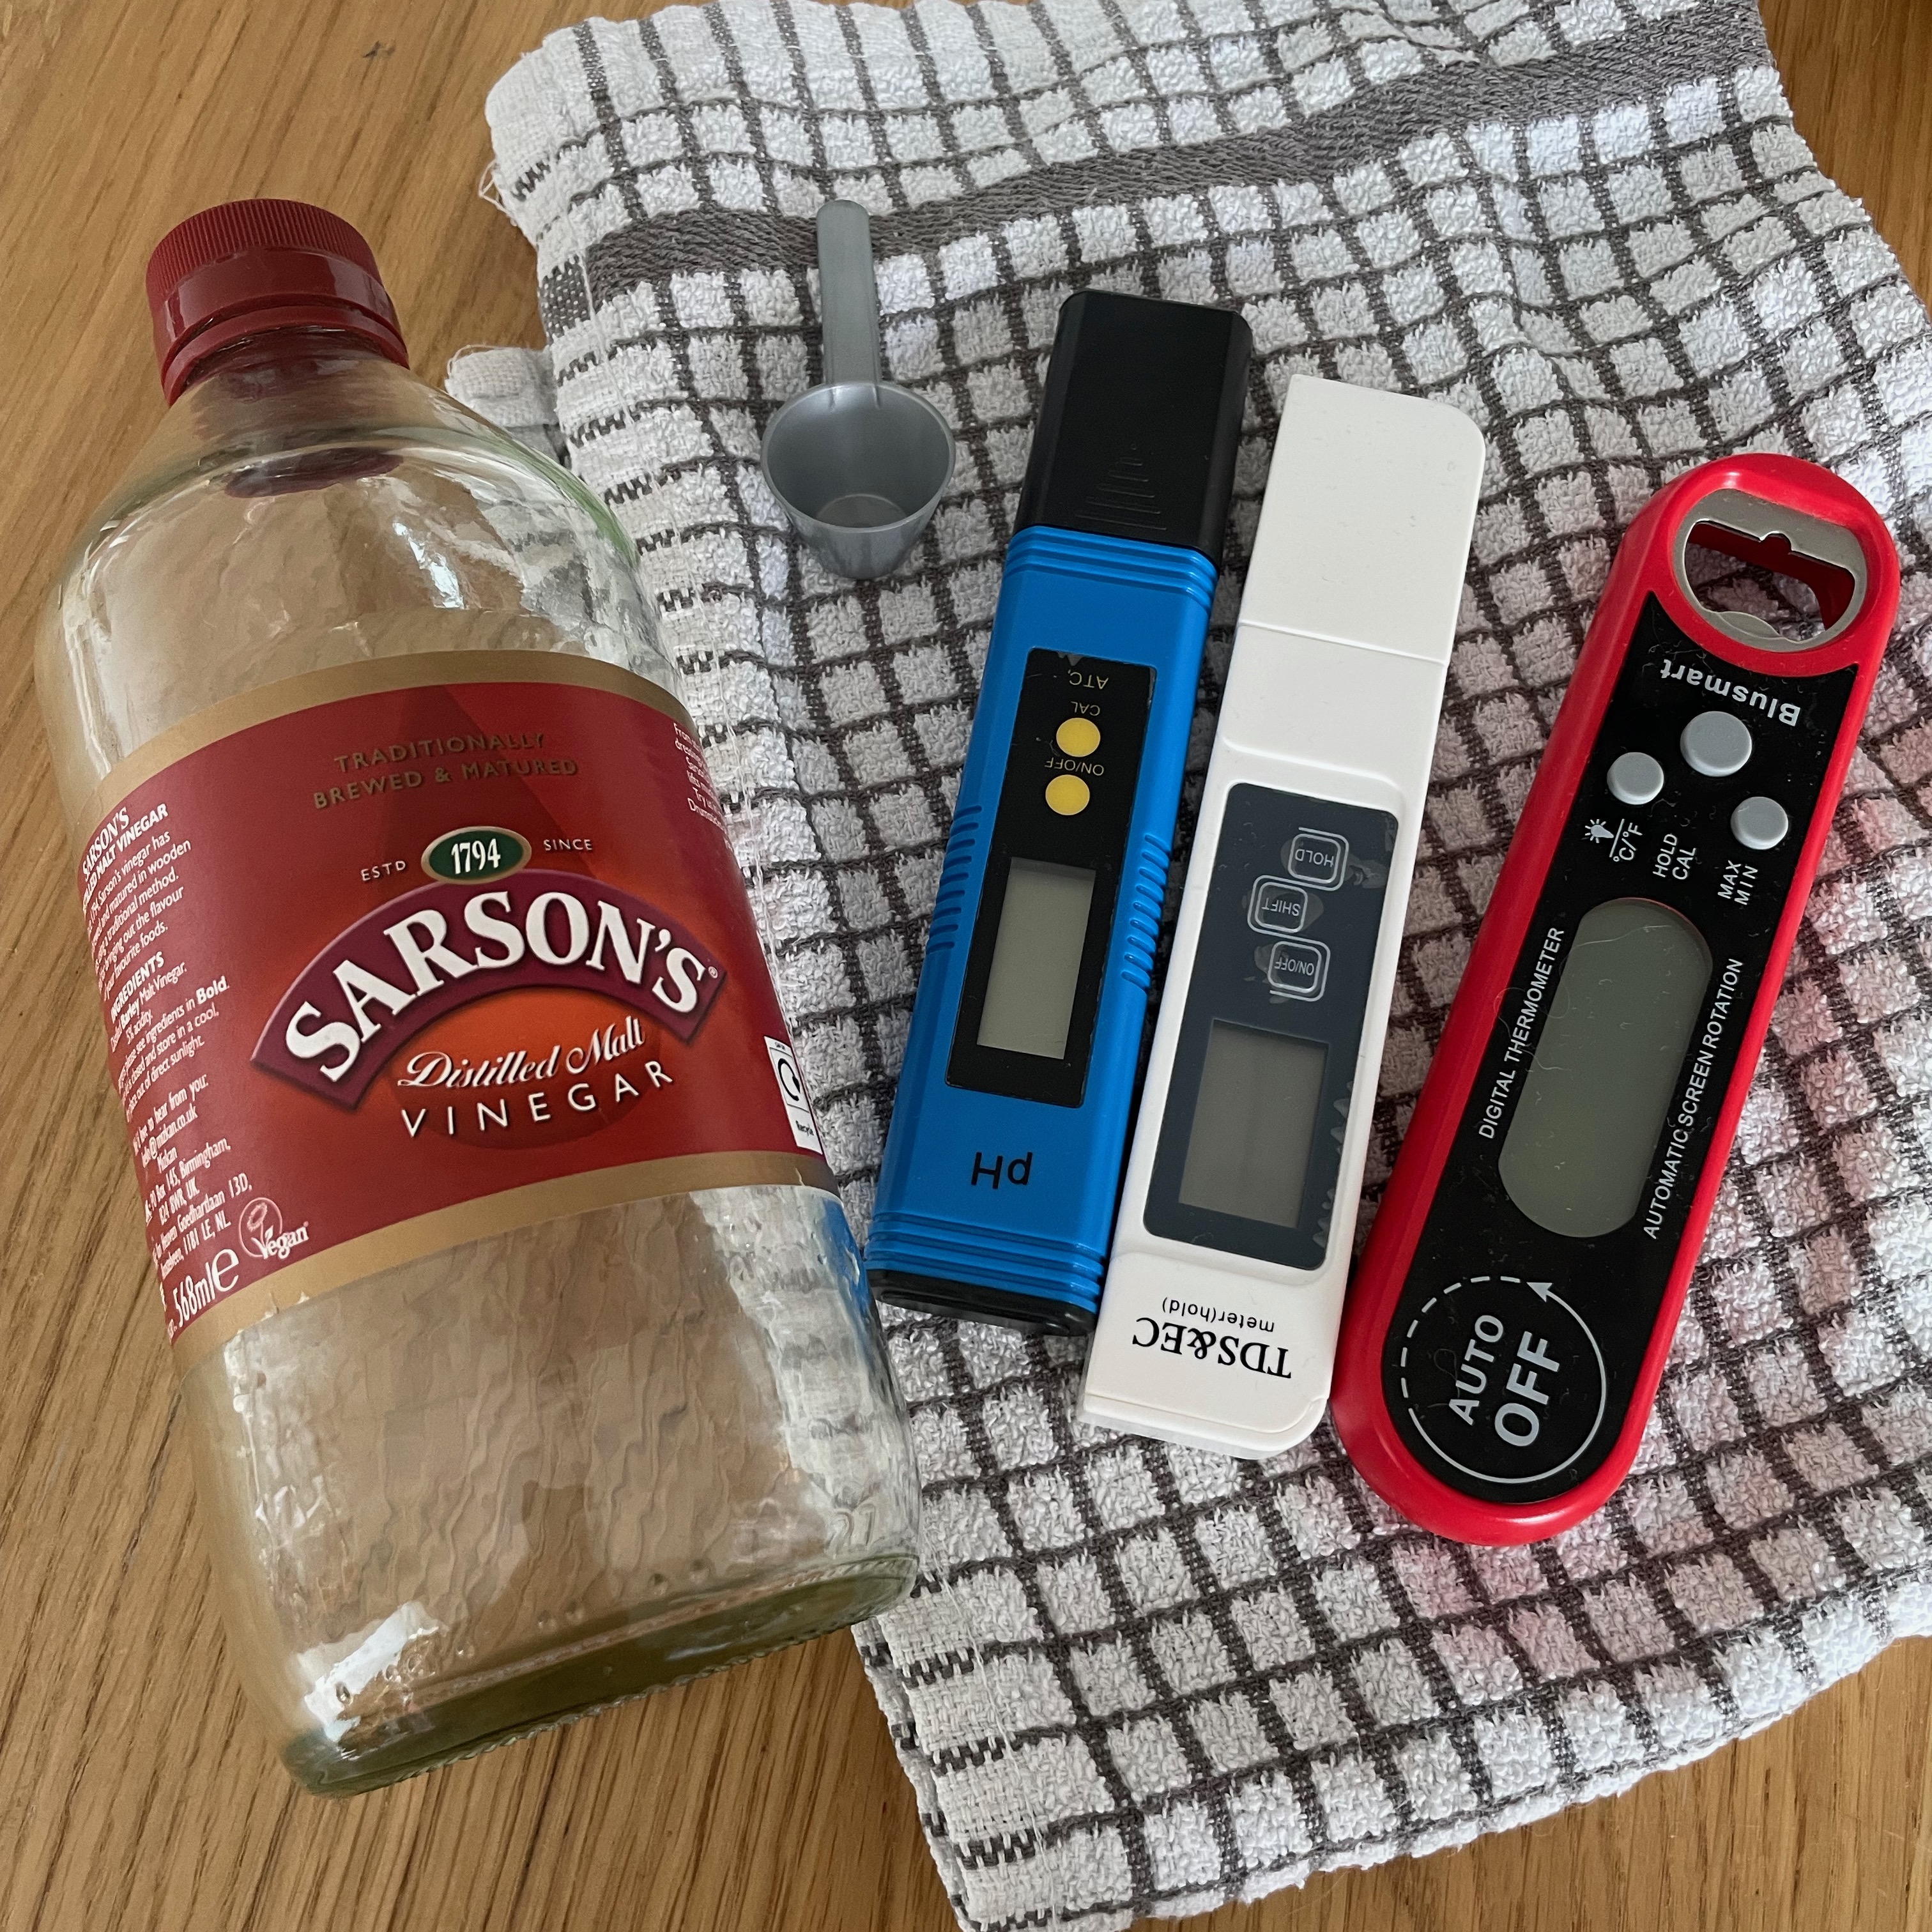
Now you may remember from Part 2 that it’s not just the bleeding I’m measuring; I also measured the pH and the hardness of the water in the jug before pouring it out, and I got some interesting results.
For the 10C test, the pH measured 8.76 – slightly alkaline, somewhere between sea water and olive oil. But at 30C, it measured 7.95, and at 50C, it measured 7.25. As the water got hotter, the pH trended towards neutral (7).
I can think of a couple of reasons why this might be. Firstly, it might just be that the warmer waters required me to fill from the hot tap as well as the cold tap, and the hot water has been affected by resting in the hot water tank for however long it’s been. The other is a bit more scientific: heat is a catalyst, which means that as the water gets hotter, molecular vibrations increase, which means that the water is more able to ionise and form hydrogen ions. Which, when translated to layman’s terms, means warmer water reads as closer to neutral pH.
Apparently the latter is something scientists often have to reckon with, so it’s good to know! I’m just measuring it for interest’s sake, but it’s good to know that this “discrepancy” is totally expected, and shouldn’t crop up again when we control for temperature.
The water hardness varied, too; it measured 236 mg/L at 10C, 293 mg/L at 30C, and 322 mg/L at 50C. The warmer the water, the harder the water. That’s interesting! I think the only explanation here is the different hot / cold water feeds; clearly there’s some limescale building up in my hot water tank. Thanks for the heads up, science!
You can watch a timelapse of all 3 temperatures and the results below (and also on my IGTV):
That’s it for this week; check back next time to see what happens in Round Two, where we repeat this experiment but start adding things into the water!